URBAN INFORMATICS
The following graphics are a collection of data analysis and graphical exercises to learn to analyze raw data and create first-hand infographics that can help visualize a better understanding of Urban trends and issues.
Urbanization of U.S. States
This was one of my first experiences in R Studio and introduction to uploading data into R, using packages like ggplot2 and just getting used to basic functions in R.

Analyzing Seattle AirBnB market
First experience with a big raw data set of more than 3800 rows and 92 variables with different class type for each variable. Learned to clean data by removing NAs and filtering out unused variables or values to create a new subset with cleaner graphics.
Important Packages: Tidyverse, ggplot2, Lubridate
Important Applications: Data Munging:- Cleaning, Filtering, Sampling, Arranging and Converting.

Data Mining and Sentiment Analysis using Twitter
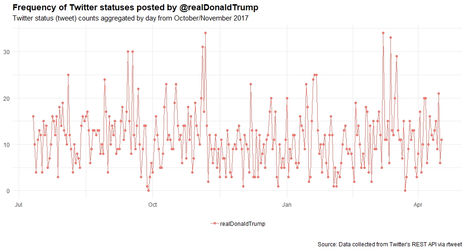
This exercise involved extracting data from existing API and cleaning data by removing character vectors and stop words associated with each tweet to get the required text data and analyze sentiment. I learned to extract data based on #Hashtag, Profile and Geographic Location from twitter and also link users/content with similar constraints.
I did this on three separate occassions: 1. Using #BikeLife 2.) Studying twitter sentiments during SuperBowl 2019 3.) Studying @realDonaldTrump profile when Mueller report was made public.
Important Packages: rtweet, tidyverse, dplyr
Important applications: Unnesting raw files to extract strip text information and analyze qualitative data. Creating word counts and networks.

Data Mining, Statistical Analysis and Machine Learning
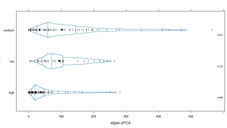
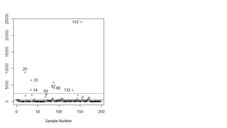
This exercise involved working with Algae dataset, which collects river water quality and content based on multiple variables. We tried to predict the relationship between variables by two methods: Linear Model and Regression Analysis.
Important Packages: DMwR
Important Applications: Regression Analysis, Looping, Machine Learning, Predicting and Identifying values.

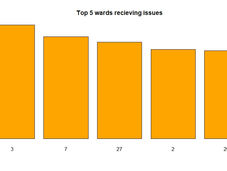
St.Louis API for registered complaints
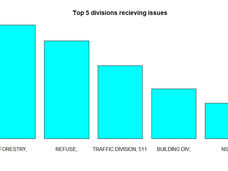
This was one of my first experiences working with an existing city API data. The exercise helped me understand how cities store their data and also how easily accessible data can help reach quick decisions in real life planning practices.
Important packages: stlcsb, mapview
Important applications: Mapping, Converting data classes, grouping

Elevation Mapping using Raster data
This exercise helped to understand the application of R as an alternative to GIS by creating raster data frames, computing values, indexing raster layers and masking raster layers on the map.
Important packages: rgdal, sp, raster, tidyverse
Important applications: Mapping, masking, plotting pixel data, indexing, linking, and calculation loopings.

Mapping Niceride rideshare data
This exercise looked at mapping Minesota's Niceride program trips and also analysing consumer demographics.


World Inequality Index by UNU-Wilder
Important packages: gganimate, wiid4,ggrepel tidyverse, gifski
Other Important Packages Experience i R
As part of learning R academically, some other packages that I have worked with in R are shiny and plotly for interactive mapping, and pdftools and recommenderlab for optical character recognition and machine learning for prediction and suggestions.
Compilation of other graphics and analysis tools
Besides working with R, the exercises also focused on learning other analysis tools like Jupytr Notebook and Atlas.ti.
The following graphics were generated using pandas, numpy, matplot, scipi and scikit learn packages for jupytr notebook.
World Happiness Index

Europe Happiness Index mapping by factors

Parking Violation in Chicago

Network analysis of Little free libraries based on pictures from pinterest
The following network was obtained based on images from pinterest on #LittleFreeLibrary. I tagged the images based on aesthetics and background and etablished a network of collected observations.

"Any complex pattern whether in time or space can be stated simply as a series of overlapping waves of multiple frequencies and amplitudes."
~Joseph Fourier
Similarly, the most powerful answer to a complex question is often simple.


